最終401例患者入圍該研究。隨訪時間中位數是48天(包含23天到129天)。患者的分類信息及臨床特征如表格1所示。
表格?1患者統計和臨床特征
Factors | Total population of the study(n=401) |
Age(range) | 61.8±15.5(18-91) |
Male/female, no. of patients | 228/173 |
Body weight (range) | 51.7±10.5(28.6-110.6) |
Primary disease, no. of patients(rate) |
|
Haematological malignancy | 157(39.2%) |
Collagen disease | 88(21.9%) |
Solid organ malignancy | 39(9.79%) |
Benign respiratory tract disease | 23(5.7%) |
Diabetes | 17(4.2%) |
Inflammatory bowel disease | 17(4.2%) |
Skin and soft tissue disease | 12(3.0%) |
Solid organ transplantation | 4(1.0%) |
Liver cirrhosis | 13(3.2%) (Child-Pugh A, 2;B,4;C,7) |
Chronic renal disease | 7(1.7%) |
Neurological disease | 6(1.5%) |
Other | 31(7.7%) |
Diagnosis of the fungal disease, no. of patients(rate) |
|
Proven | 99(24.79%) |
Candidiasis | 46 |
Aspergillosis | 37(coinfection with cryptococcosis:1) |
Cryptococcosis | 9 |
Other | 8 |
Probable/possible | 209(52.19%) |
Undiagnosed ? (empirical therapy) | 93(23.2%) |
Route of administration in initial therapy |
|
Intravenous | 119(29.7%) |
Oral | 282(70.3%) |
在接受負荷劑量的患者中,初始治療日的中位劑量(IQR)為5.9 mg/kg,每日2次(5.4 ~ 6.1)。維持劑量中位值為3.8 mg/kg。TDM的實施主要在治療開始后6天左右。血藥谷濃度中位值為3.33 ug/ml。其中,29.6%的患者Cmin≥5 ug/ml,6.6%的患者≤1 ug/ml(如表格2所示)。
表格 2 伏立康唑初始谷濃度
Initial Cain | Total(n=401) | Adequate dosing and timing of TDM(n=226) |
| (interquartile range) (ug/mL) | 3.33(1.90-5.13) | 3.91(2.50-5.48) |
Cmin?? categories |
|
|
<1ug/mL | 44(11.0%) | 15(6.6%) |
1-5ug/mL (target concentration range) | 249(62.19%) | 144(63.79%) |
≥5ug/mL | 108(26.9%) | 67(29.69%) |
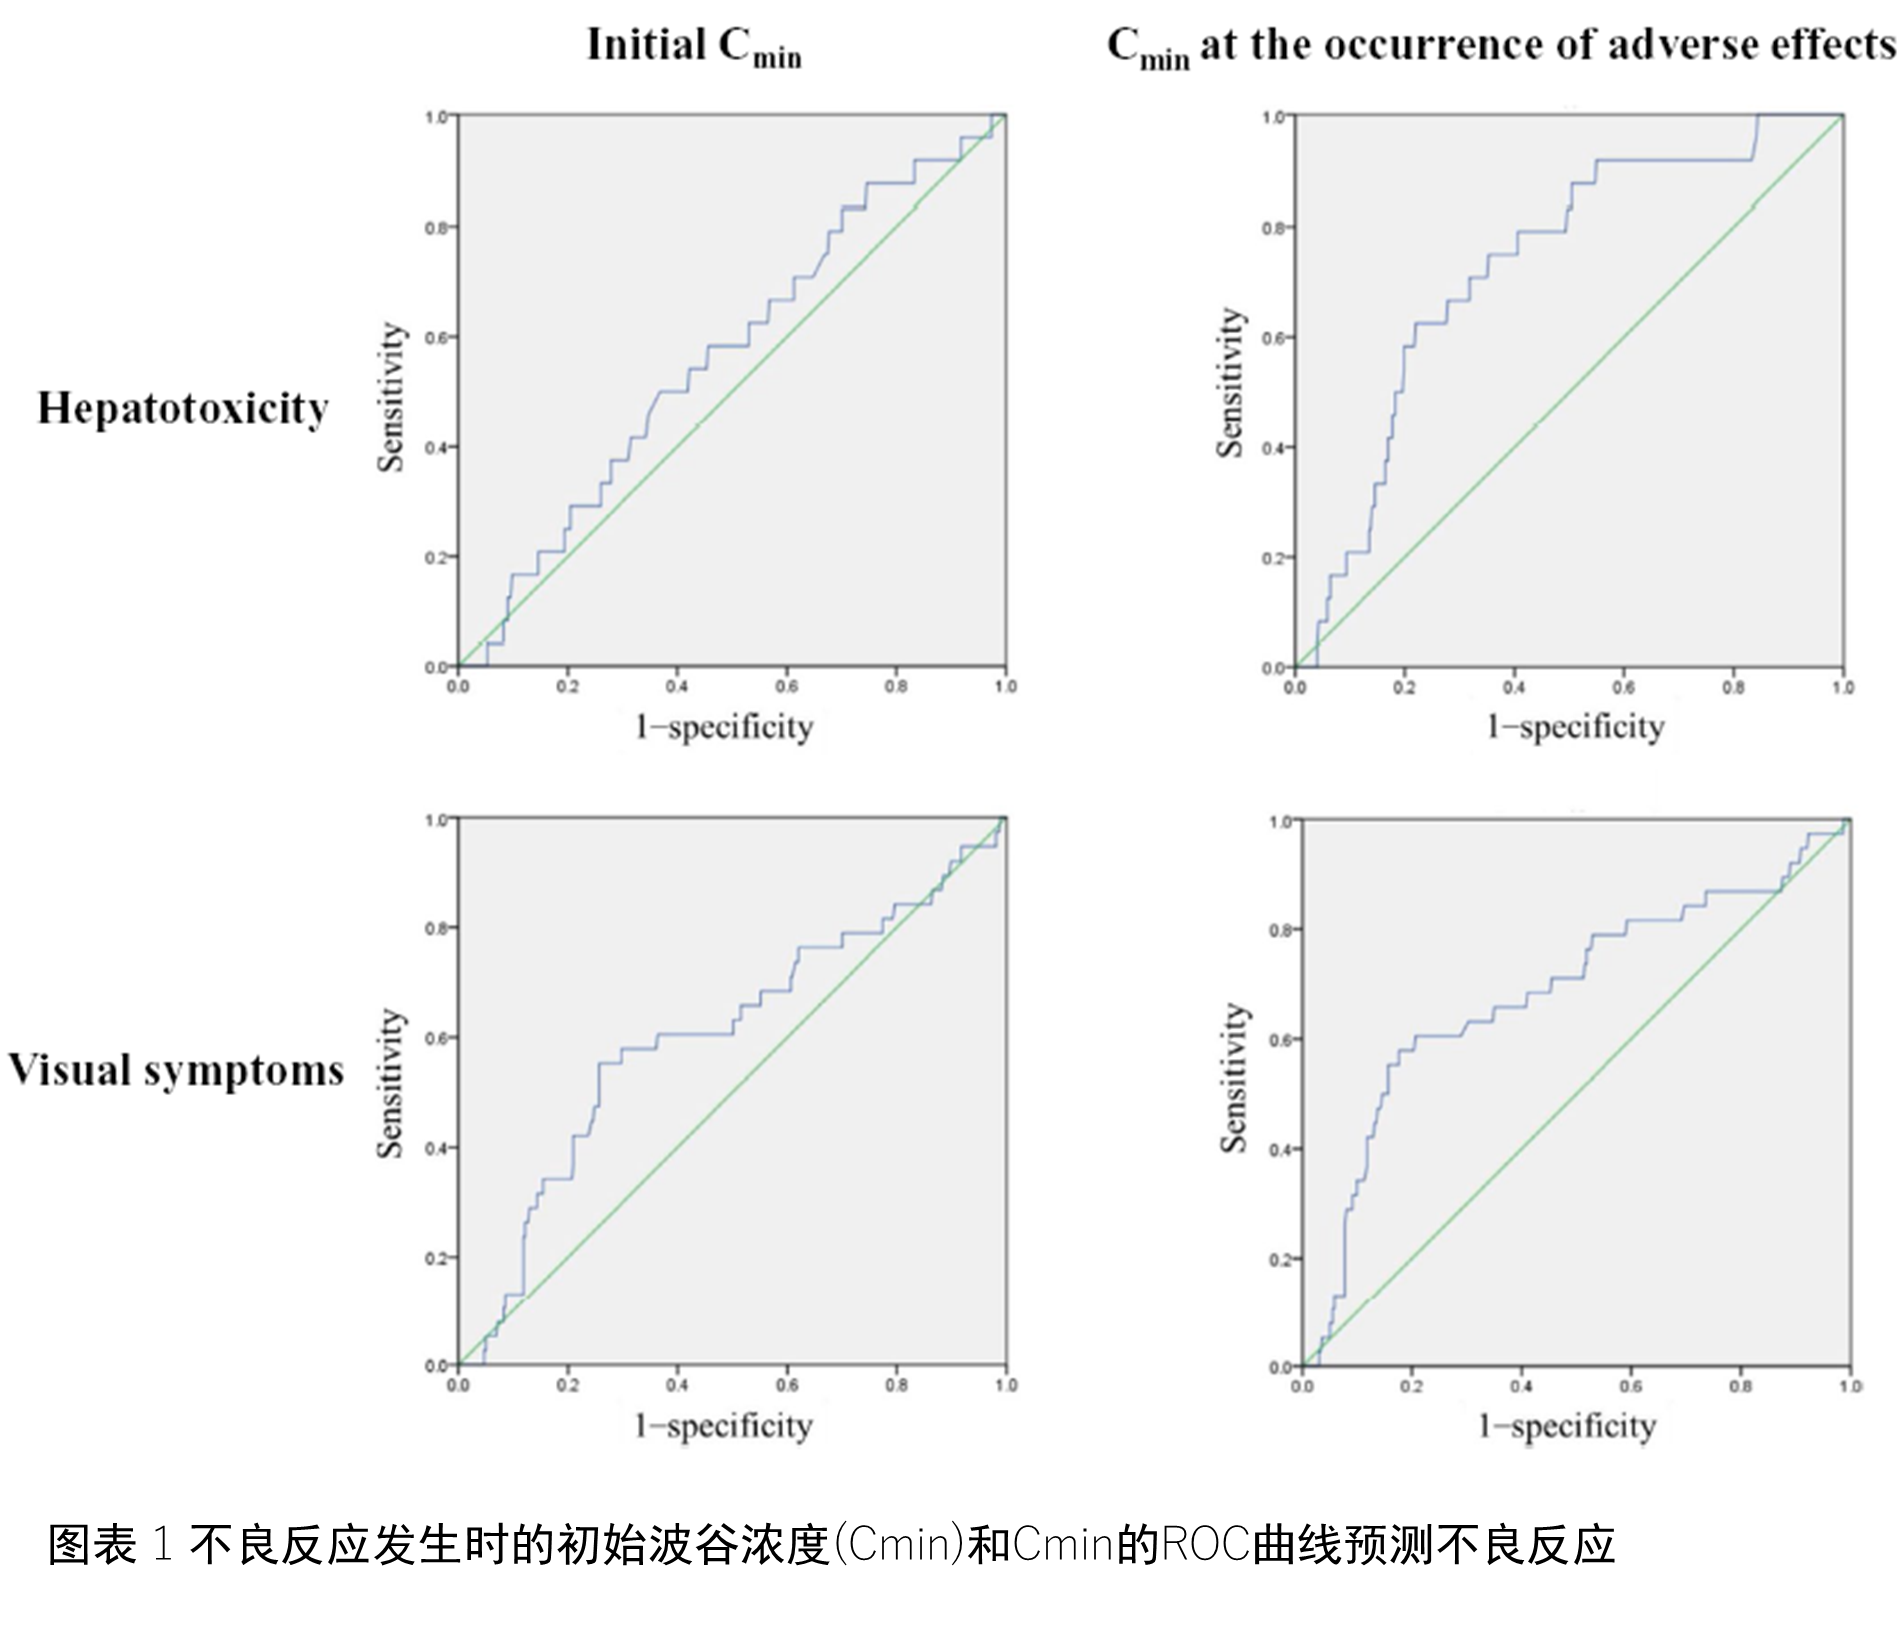
治療過程中,有24位患者(6.0%)發生了肝臟毒性,38位(9.5%)患者出現了視覺癥狀。10位患者因為肝臟毒性作用暫時終止了伏立康唑的服用,而有11為患者也因為視覺癥狀而終止。圖1展示了采用ROC曲線分析伏立康唑血藥谷濃度和副作用的關系結果。盡管較高的起始Cmin與視覺癥狀有相關性(AUC 0.603, cut-off 4.9μg/mL, OR 3.59, P = .037),但是卻與肝臟毒性沒有顯著相關性(AUC 0.562, cut-off 3.6 μg/mL, OR 1.67, P = .292)。但是Cmin卻與肝臟毒性(AUC 0.725, OR 5.20, P < .001)和視覺癥狀(AUC 0.684, OR 5.89, P < .001)都有明顯相關性。推算的肝臟毒性Cmin?cut-offs值為4.2 ug/ml, 視覺癥狀Cmin?cut-offs值為3.5ug/ml。針對Cmin較高且發生了肝臟毒性(8例)或視覺癥狀(27例)的患者進行了劑量減量,使其Cmin恢復到標準水平,其副作用均得到了緩解,并完成了整個伏立康唑的治療療程。表格3顯示了其實Cmin的分布以及劑量的調整。

表格 3 根據伏立康唑初始谷濃度(Cmin)調整伏立康唑劑量
| Subsequent Cmin?(ug/mL) |
Dose ? adjustment | <1 | 1-5 | ≥5 | Total | No data available |
Dose adjustment (n=120) ? | 3(2.7%) | 96(87.3%) | 11(10.0%) | 110(100%) | 10 |
Dose reduction (n=95) | 1(1.2%) | 74(87.0%) | 10(11.8%) | 85(1009%) | 10 |
Dose increase (n=25) | 2(8.0%) | 22(88.0%) | 1(4.09%) | 25(100%) | 0 |
Same dose (n=220) | 18(11.6%) | 128(82.69%) | 9(5.89%) | 155(100%) | 65 |